Query Throughput on Analytics on OLTP (Postgres)
 Vladimir Makovsky, 2015-06-30
In our third blog post, we showed simple Git analytic using our OLAP MIA database with automated micro-caching. You can check updated version of the git analytic application here. In our fifth blog post, we also showed how positive effect automatic caching can have on performance boost. For better comparison let's find out approximate request throughput of the application on PostgreSQL.
PostgreSQL is an OLTP database but it is used in analytics as well as many other OLTP databases. In fact, it's quite fast in an analysis of a small amount of data. On the amount of data that's in git analytic, Postgres performs queries faster than many of the new OLAP databases.
The reason is that many OLAP vendors don't pay much attention to the query throughput on a small amount of data. I actually read a comment from one OLAP vendor: "We are a data warehousing vendor. We take queries that run minutes or hours and run them in seconds. And we also take queries that run milliseconds and run them in seconds." That was obviously a joke, but not that far from the truth.
Test
For our test, we take dashboard with reports and simulate request that is necessary to compute the reports on the dashboard. We took 16 projects and run series of selects that correspond to requests from the application. These reports can be written as the following select statements:
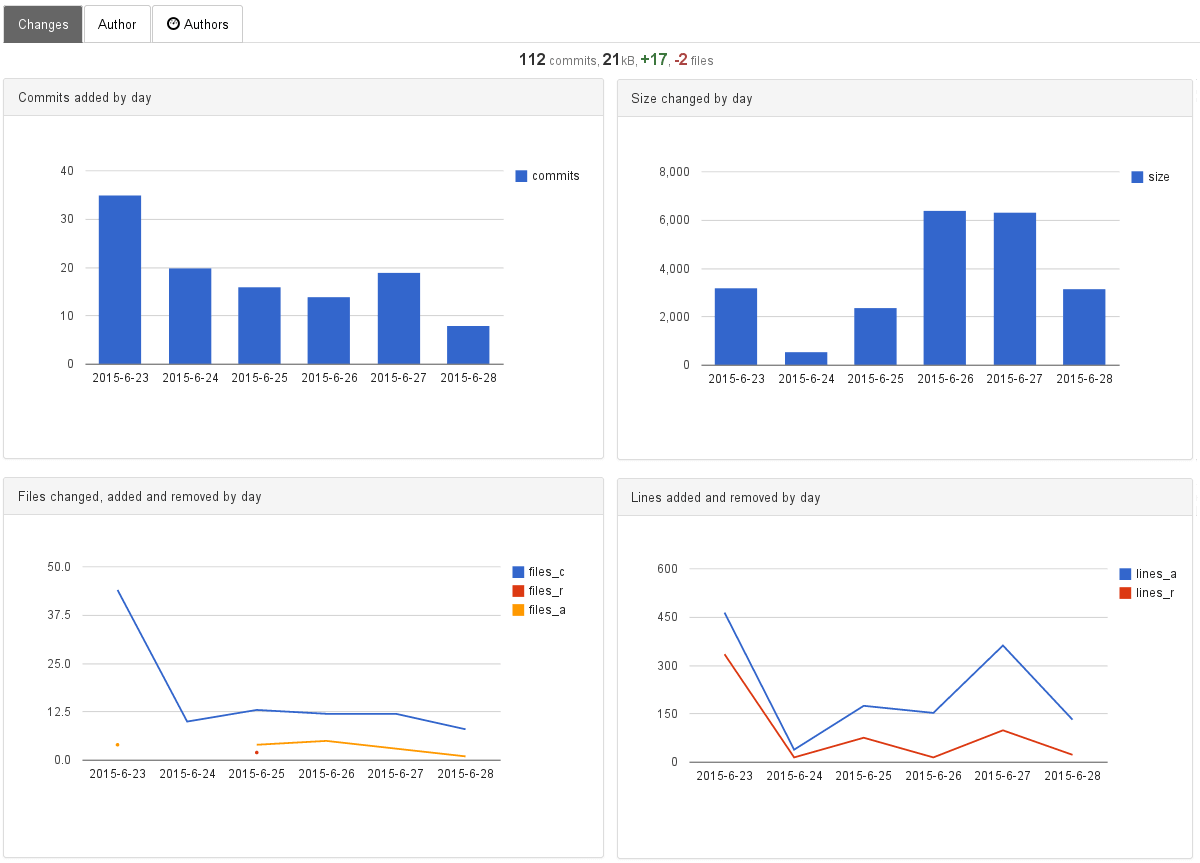
-- commits by day
SELECT date_id, COUNT(*)
FROM commit
WHERE date_id>16611
GROUP BY date_id

-- size changed by day
SELECT date_id, SUM(size_changed)
FROM fact, commit
WHERE commit_id=commit.id AND date_id>16611
GROUP BY date_id

-- file changed, added, deleted, modified by date
SELECT date_id, file_change_type_id, COUNT(*)
FROM fact, commit, file_change_type
WHERE commit_id=commit.id AND file_change_type_id=file_change_type.id
GROUP BY date_id, file_change_type_id HAVING date_id>16611

-- lines added and deleted by day
SELECT date_id, SUM(lines_added), SUM(lines_deleted)
FROM fact, commit
WHERE commit_id=commit.id AND date_id>16611
GROUP BY date_id
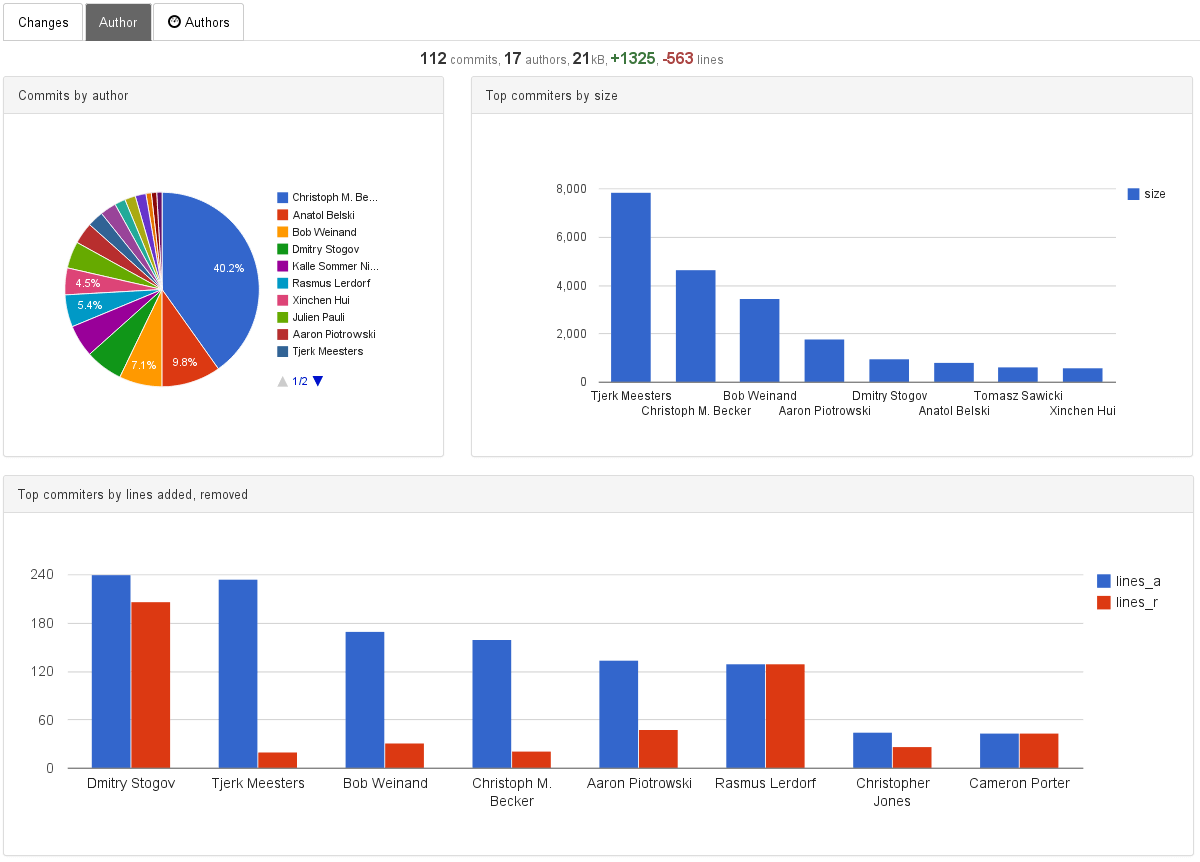
-- commits by author since certain date
SELECT author_id, COUNT(*) AS CNT FROM author, commit
WHERE author_id=author.id AND date_id>16611
GROUP BY author_id

-- size changed, lines added and deleted by author since certain date
SELECT author_id, SUM(size_changed), SUM(lines_added), SUM(lines_deleted)
FROM author, commit, fact
WHERE author_id=author.id AND commit.id=commit_id AND date_id>16611
GROUP BY author_id
Postgres when running reports on Code and Author tabs for the last 10-40 days were able to execute queries that correspond to 256 req/s and 384 req/s. See the table below.
| Last 10 - 40 days | ||||||||||||||
|---|---|---|---|---|---|---|---|---|---|---|---|---|---|---|
| Tab | PostgreSQL | Briskat (MIA DB) | ||||||||||||
| Code | 256 reqs/s | 944 reqs/s | ||||||||||||
| Author(s) | 384 reqs/s | 1626 reqs/s | </table>||||||||||||
| Last 335 - 365 days | ||
|---|---|---|
| Tab | PostgreSQL | Briskat (MIA DB) |
| Code | 16 reqs/s | 481 reqs/s |
| Author(s) | 42 reqs/s | 415 reqs/s | </table>