Lessons Learned While Crunching Open Data
 Vladimir Makovsky, 2015-12-08
There has been growing number of open data publicized by governments and local governments. Open data includes a lot of valuable information which has a lot of potential usages. We created a mashup that shows the property prices over the last 20 years in England and Wales. It’s built upon the public dataset from UK Land registry which has over 20 million sales record of properties. The mashup also includes some data from the 2011 UK census and police data. Let me show you some lessons we learned:
-
Non-parsable format of data. The common issue of open-data-like public portals is that their data is often distributed only in human-friendly document formats (PDF or Excel) which are complicated for automatic processing. What a waste of time. We used only well maintained and developer-friendly datasets. An example of pretty nice and developer-friendly public portal is NYC Open Data.
-
Data precision. Whenever data is collected by people there are some errors, some records are simply wrong. We found 19 wrong postcodes for sold property in Land registry dataset (just very obvious ones). Or another example there is about 2.7% of flats recorded as freehold. Quite likely some buyers describe their flats as freeholds while they are leaseholds. So bear in mind that with a new batch of data you may need to apply some fixes.
-
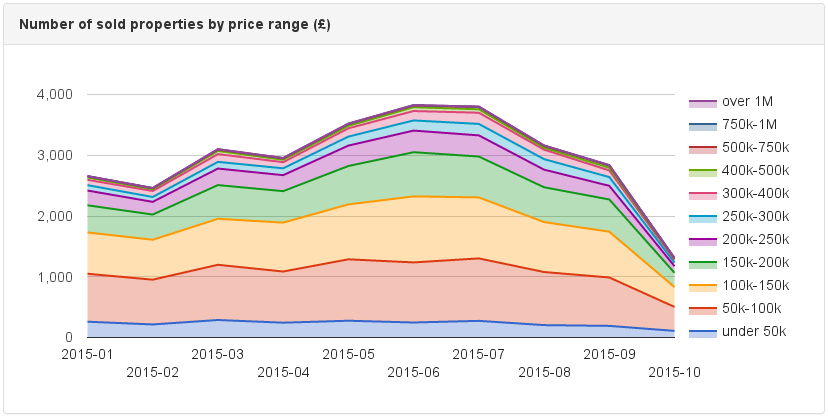
Delayed data. In our case, Land registry updates the dataset of sold properties once a month. It’s not obvious, but quite a lot of sales are reported with a delay of up to 3 months. So be careful to make conclusions. In the following graph of sold properties, it looks like the property sales are falling off a cliff but there is some missing data which will be added later.
- Source data can change. Source dataset can change,
and even small modification can cause some trouble e.g. extra quotes or additional column.
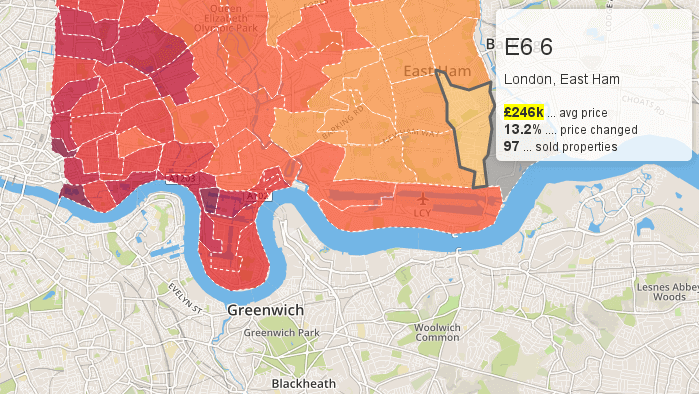
Another example, in the last batch in October 2015, the Land Registry added a new type of property
to the source data. These properties were some commercial properties like warehouses with
a high price tag. So e.g. in London, East Ham in E6 6 postcode
sector with an average property price of £246k the price bumped up to £846k.
And some other areas in East London looked liked posh areas in Kensington.
-
Anonymization. For privacy reasons public datasets with personal information are anonymized. The more data is anonymized the less valuable information we can get from data. When the data is anonymized they are typically aggregated at a higher level and some information is lost. E.g. in census 2011 data you cannot find an average age of women or men in a particular area. Or some small amount of data is overwritten with a false information.
On the other hand, property price paid data is not anonymized. It was concluded that information in this data is not personal but related to a property. Nevertheless, it took a lot of effort to make this data publicly available (see Privacy Impact Assessment Report). -
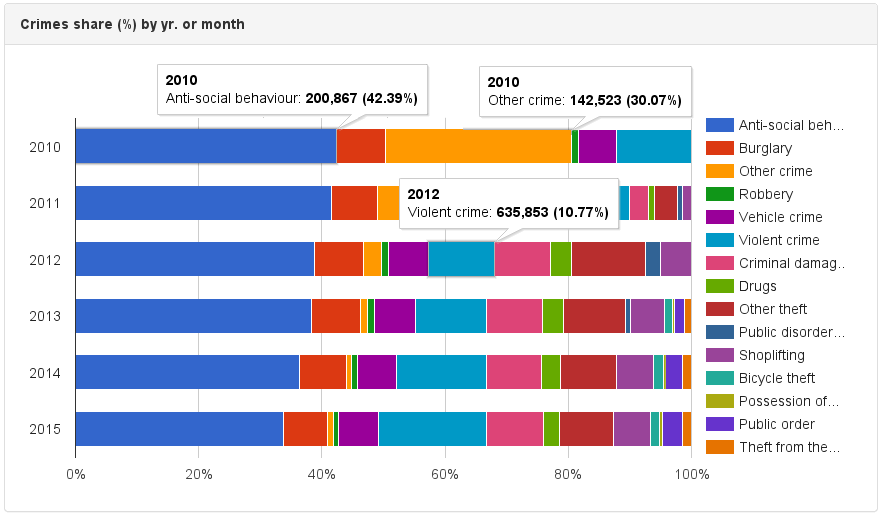
A methodology can change. If you look at the crime graph ‘Other crime’ category had 30.07% in 2010. The category was clearly re-classified to more categories in the following years. Secondly, but it is a speculation, that some crimes in ‘anti-social behavior’ category could be later classified as a violent crime as the total % share of these two categories is almost the same between 2012-2015. We could possibly verify this speculation if the data were less anonymized.
-
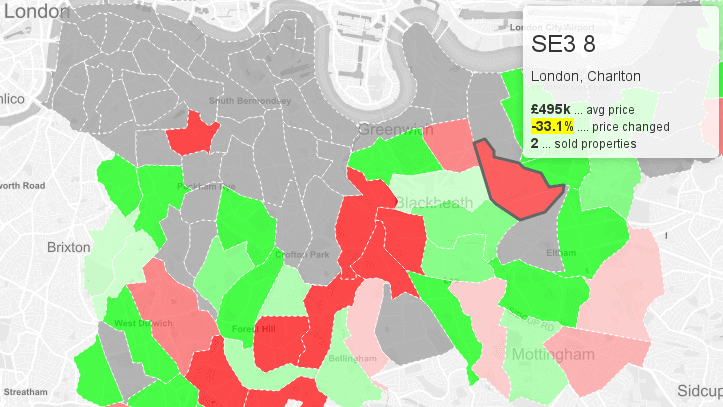
Not enough data volume. Some data sources may not have enough relevant data and conclusions based on them are simply wrong. But we have to be careful even on a high volume of data. Let’s say we want to see % price change of detached houses compared to previous year. E.g. in SE London there are only a few detached houses being sold every year. By October 2015, only two detached houses were sold in SE3 8. It is too low to get a good estimate of % price change.
-
Don’t make premature conclusions. This basically summarizes the five previous points. Before making any conclusion, double check the facts and inspect the data.
-
Geographical data. Geo data has their own category of issues. E.g. some postcodes changes over the time, different datasets have recorded geographical information in many different ways. E.g. record in Land Registry has a postcode, record in crime data has latitude and longitude, record in census 2011 has output area. It’s not easy to combine a different kind of geographical information. We may come back later with another blog post on this topic.
- Graph visualization matters. This is a broad topic but at least here is a list of 7 most common chart mistakes.
Last but not least, once you have been digging into your data for a while don’t forget the curse of knowledge. Many things that are obvious to you are not obvious for other people.