Gitcharts tutorial
Keep your repo tidy.
Gitcharts is an analytic online service for git repositories. It helps you to find anomalies in a git repository using interactive graphs. Only public GitHub repositories are supported (at the moment). Repositories are updated twice a day.
Select date
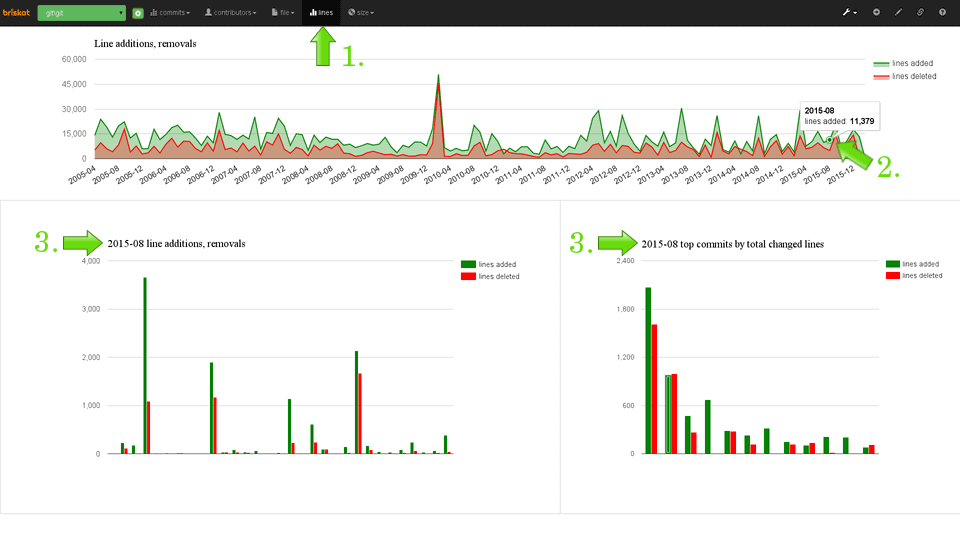
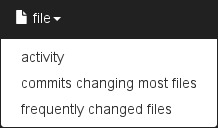
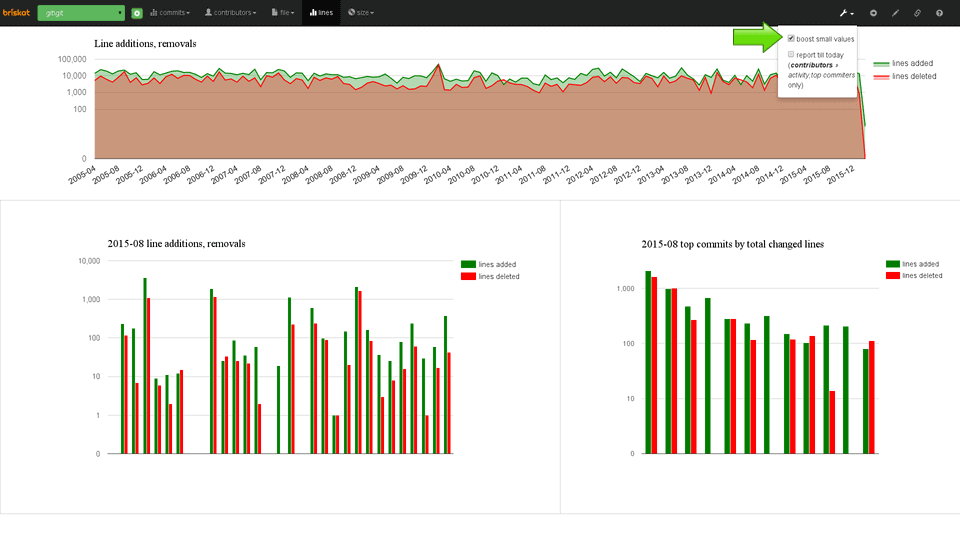
- Select lines dashboard from the top left menu.
- Select 2015-08 in the first graph.
- In the second graph, numbers of added and deleted lines by days in August 2015 show. Top commits by a sum of changed lines in August 2015 appears in the third graph.
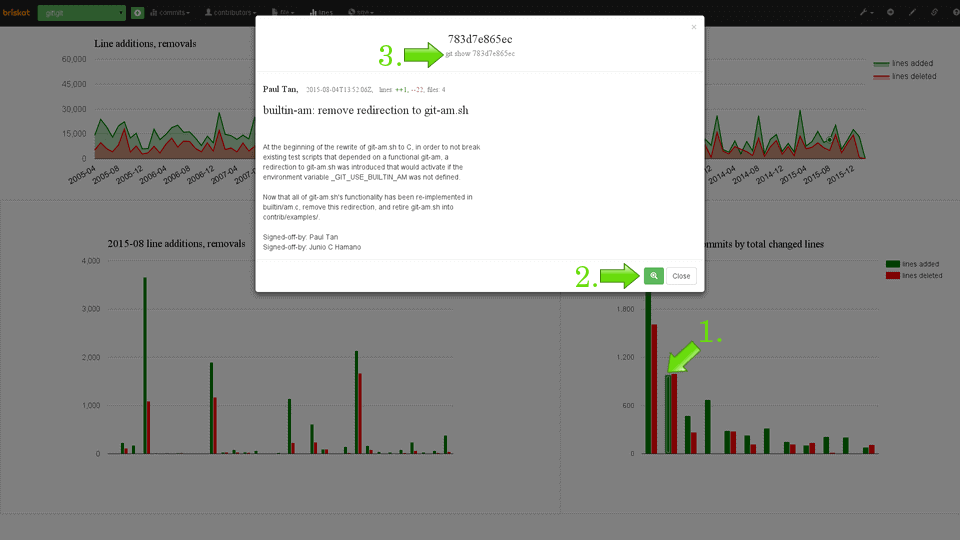
View a commit detail
List of dashboards
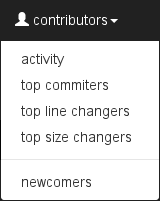
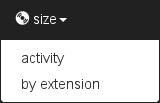
In the top left menu, there are other dashboards which can be controlled the same way. Here is an expanded list of other dashboards. In a few cases, there isn't any pop up window.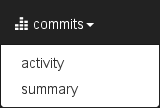

Boost small values
- Check boost small values checkbox in the top right menu.
- Uncheck boost small values checkbox.
Find top contributors
You can find top commit contributors for the last few months (or for the whole history):- Select contributors » activity dashboard in the top menu.
- Check report till today box in the top right menu.
- The activity report now shows top committers for the last few months (from August 2015 till a current month, i.e. February 2016). By clicking on other months in the first graph, you can easily see differences during the time.
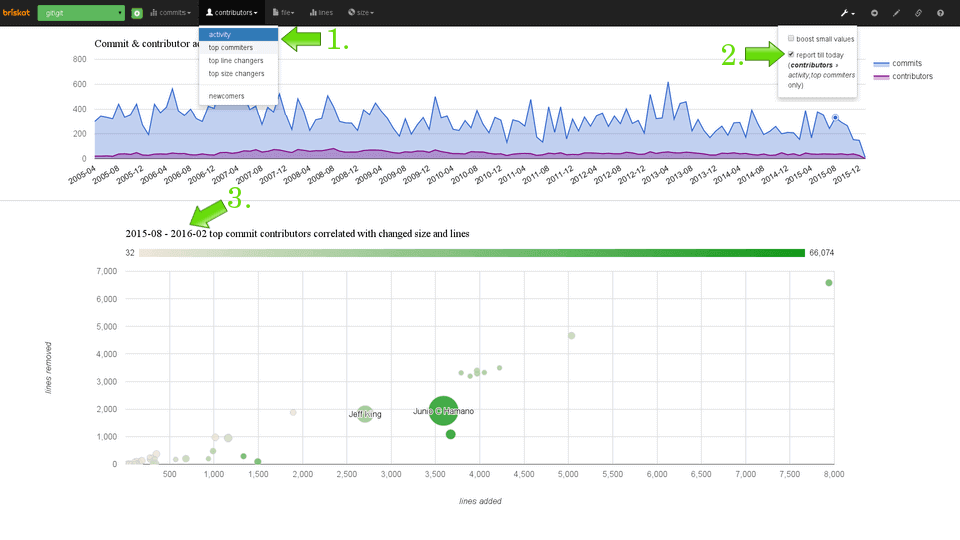 Top committers the graph shows a correlation between the number of all commits (bigger bubble means more commits),
line additions (x-axis), line removals (y-axis) and total changed size (red to
green color spectrum).
Top committers the graph shows a correlation between the number of all commits (bigger bubble means more commits),
line additions (x-axis), line removals (y-axis) and total changed size (red to
green color spectrum).